Average Annual Stock Price Movement
Stock prices move a lot in normal years. This covers how much, why a drop is harder to recover from than it looks, and how to check whether price movement is signal or noise.
The simplified family tree of value investing: Graham & Dodd, then Buffett, then Buffett & Munger, then everyone else. Peter Lynch is one of the few in “everyone else” with rare, original ideas.
1. A single stock often moves 50% to 100% in a normal year
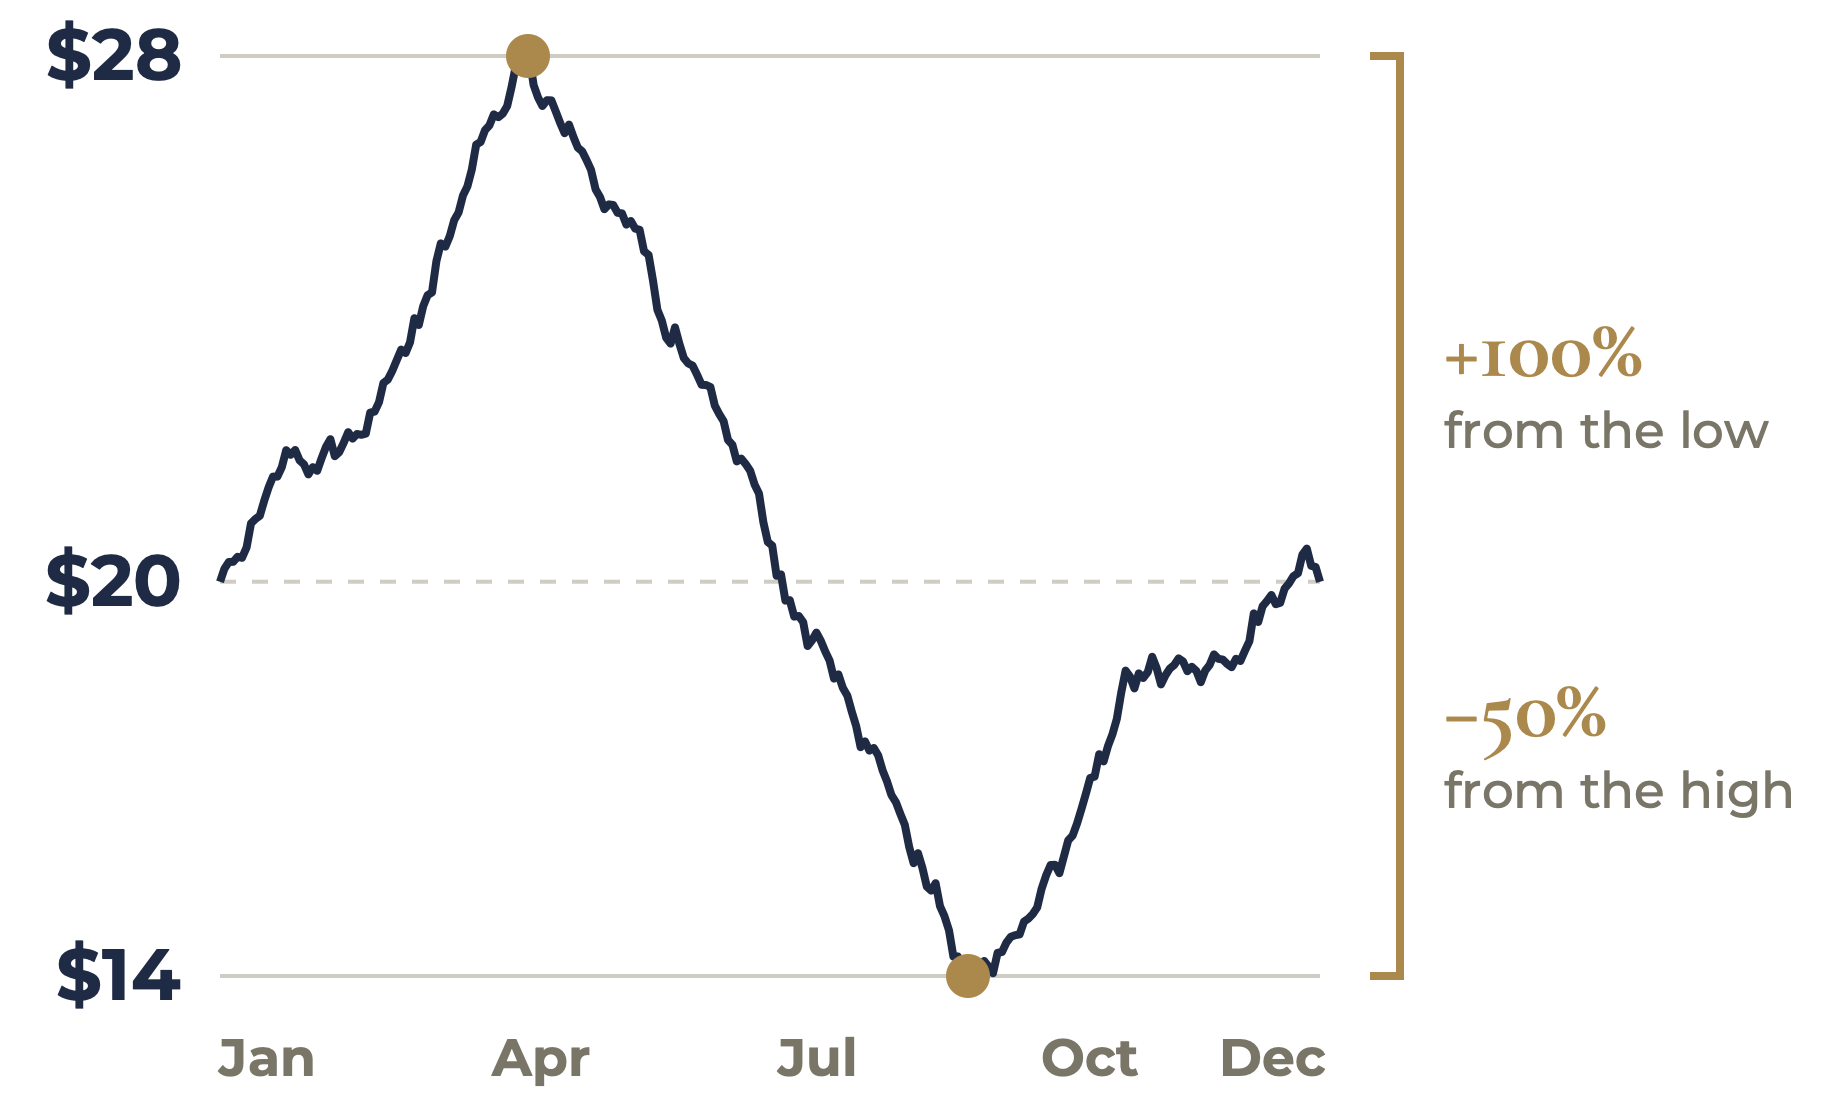
Lynch ran one of the best-known mutual funds for 13 years, until 1990. He also wrote One Up on Wall Street, one of the best-known investing books for individuals. In it he wrote (1989) that the average stock’s price moves about 50% between its low and its high in a typical year. In a 2025 conversation with Josh Brown, he put it higher. He said the gap between the average stock’s high and low “every year is 100%.” His example: a stock starts the year at $20, rises to $28, falls to $14, and ends at $20. That is half the price gone at one point, in a normal year, and maybe with nothing even wrong or changed with the company.
A normal year for one stock.
2. The whole market drops about 14% within a typical year
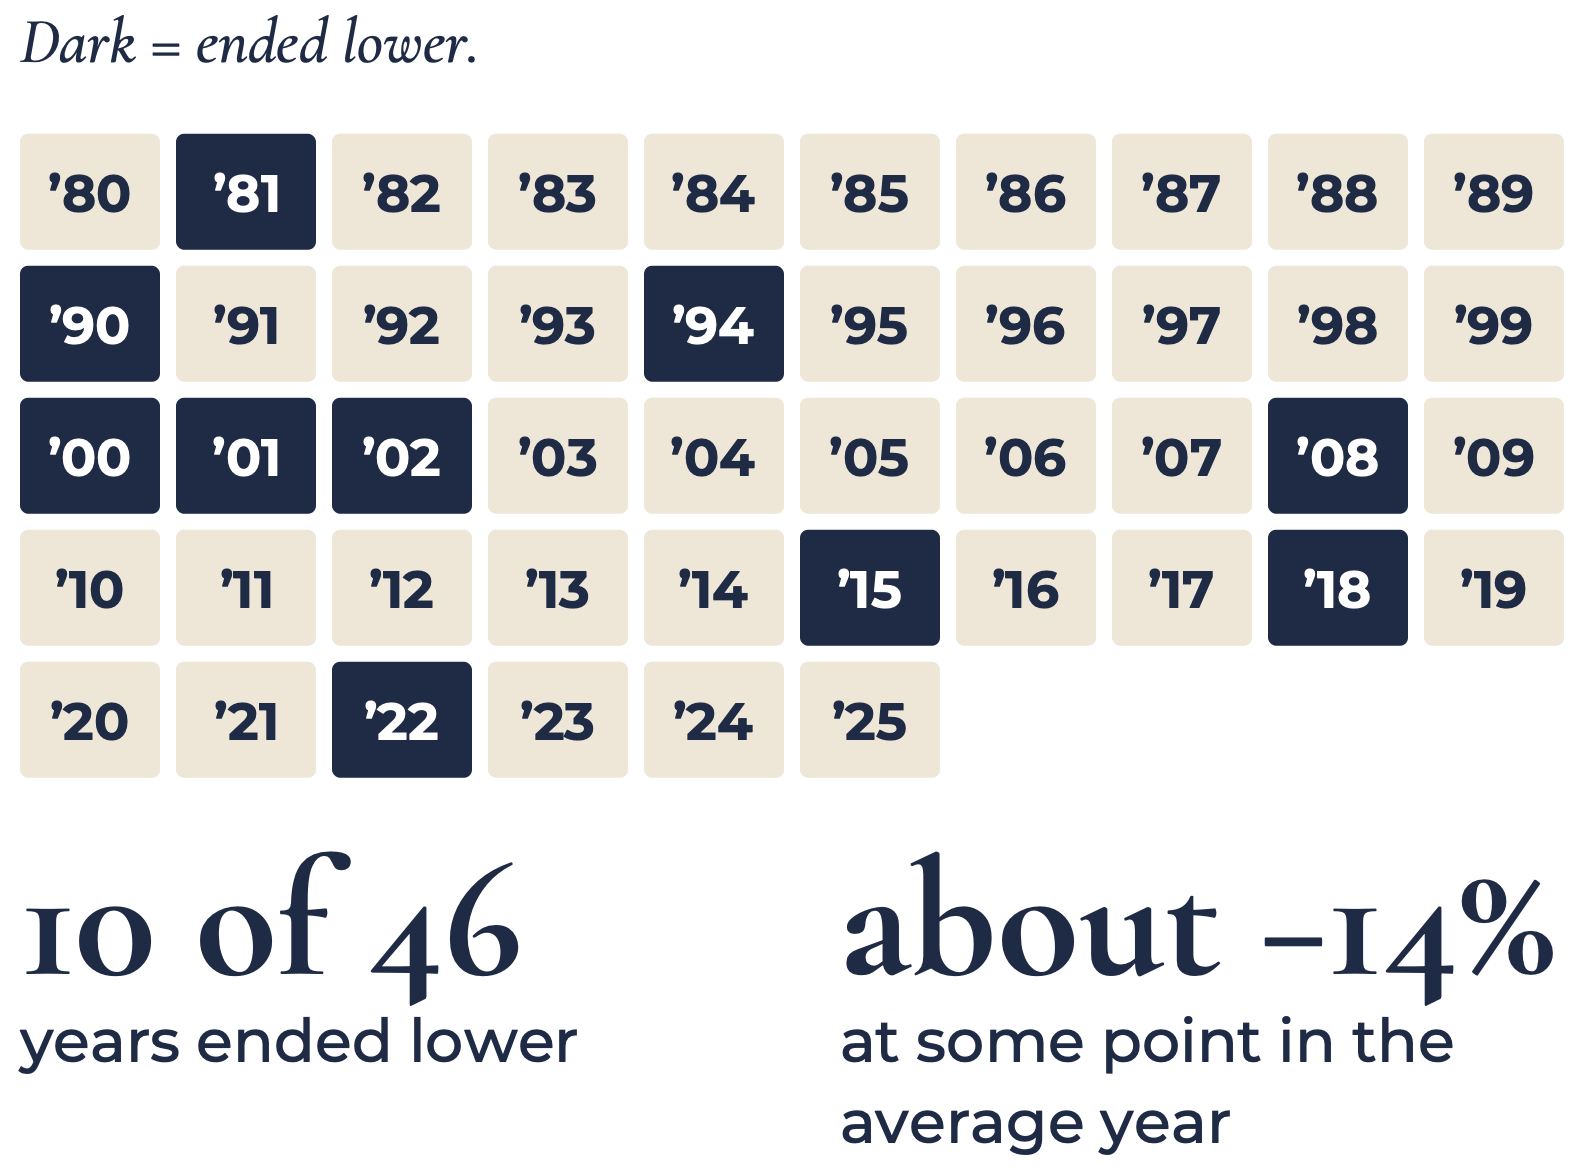
An index moves less than one stock because its companies rarely fall at the same time. Since 1980, the S&P 500 has fallen about 14% at some point in the average year (LPL Research). Only 10 of the 46 years from 1980 to 2025 ended lower (MFS). What matters is what the business, or the market, earns over many years. One year is an arbitrary measurement, and too short. Any period is somewhat arbitrary for measuring return. The most useful is a full business and interest rate cycle. That may be too long for most people. Thinking long is an advantage we use.
The S&P 500, 1980–2025.
3. A drop takes a bigger gain to recover
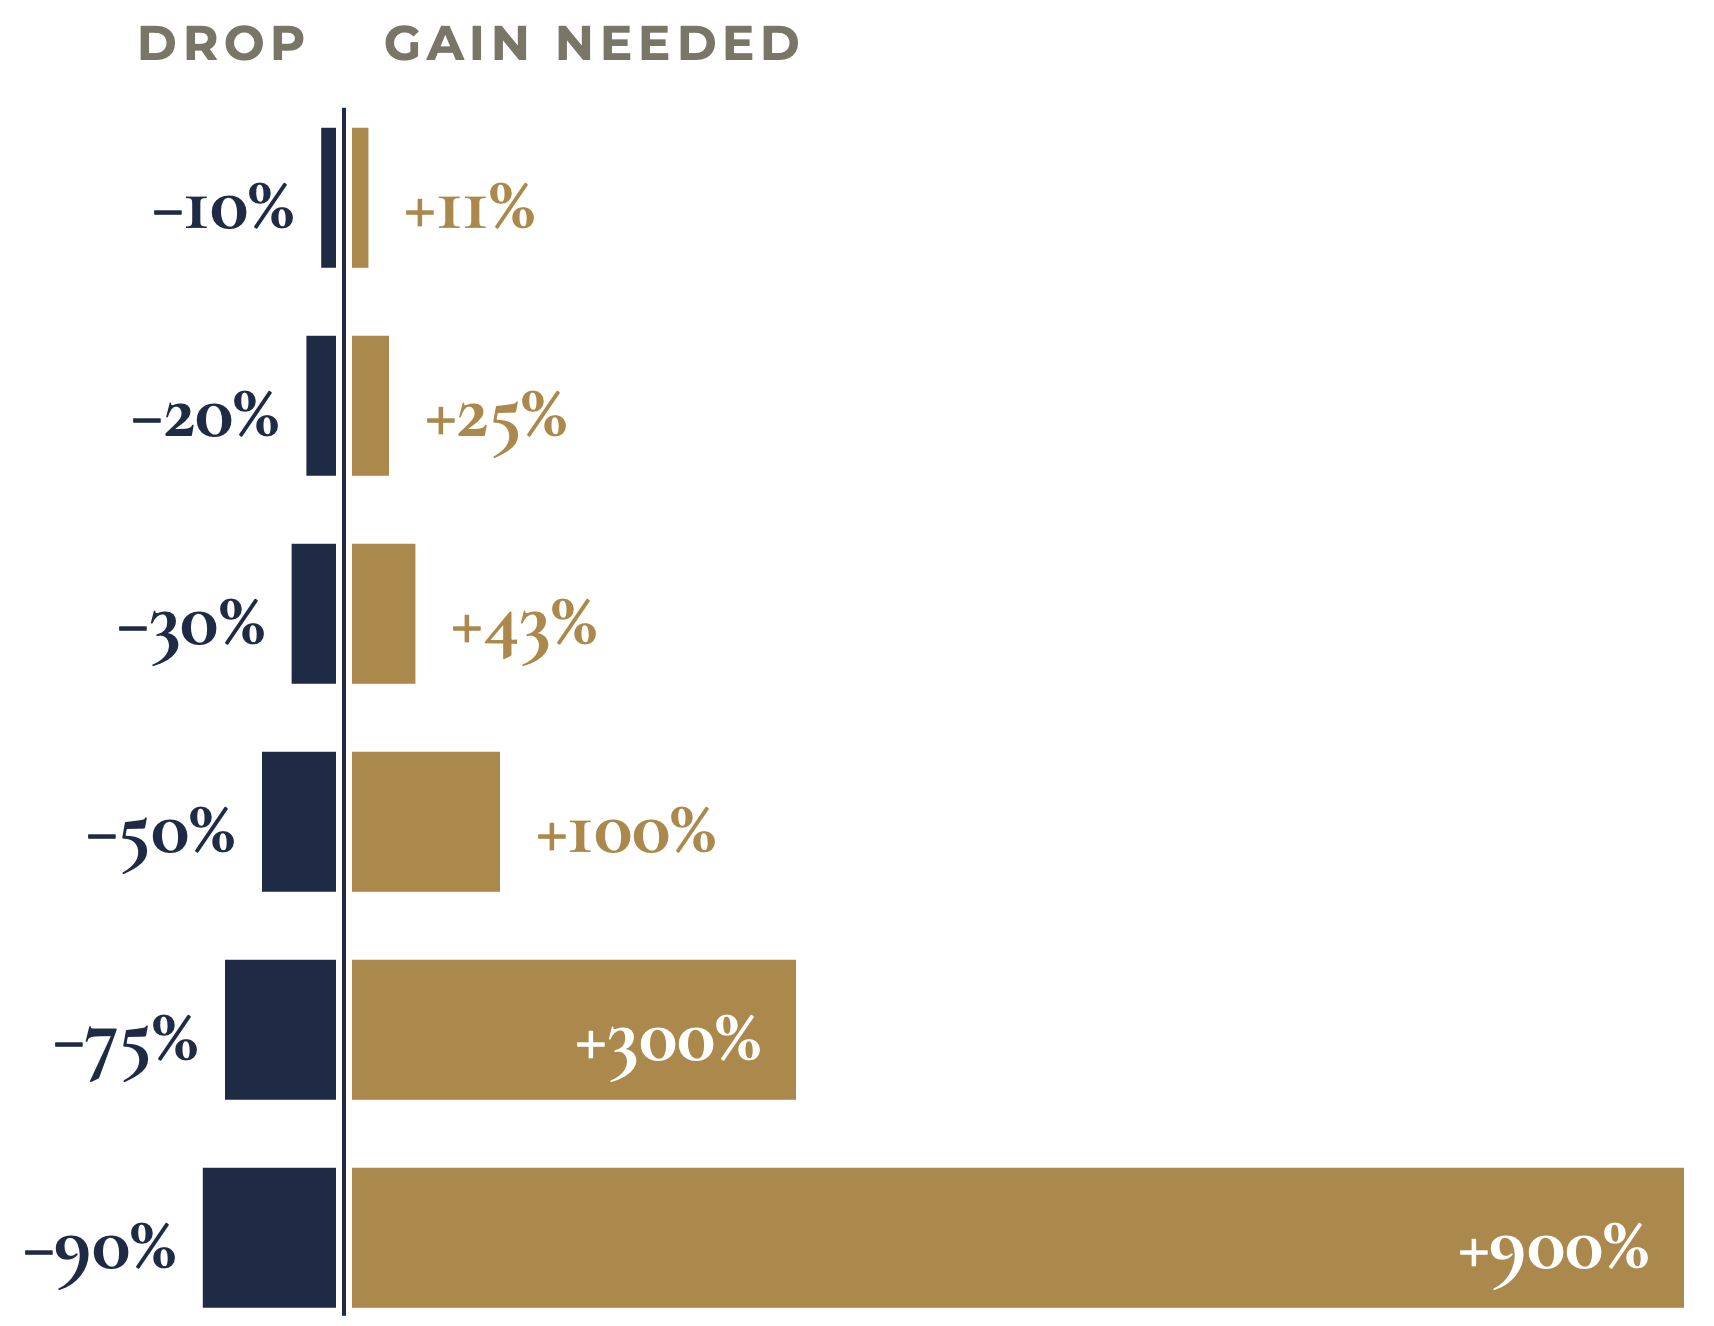
A $100 stock that drops 30% is worth $70. A 30% gain from $70 brings it to $91, not $100. To get back to $100, it needs a 43% gain. After a 50% drop, it needs a 100% gain.
This is why experienced, fundamental investors tend to focus on avoiding permanent loss rather than avoiding volatility. Volatility is part of the game, and it can be an advantage to a good investor, because it is when good businesses are offered at lower prices. Permanent loss comes from three places: a business that is permanently worth less, paying too much, or being forced to sell during a drop.
The gain needed to recover.
The gain needed to get back to even, drawn to the same scale.
4. The loss is capped. The gain is not.
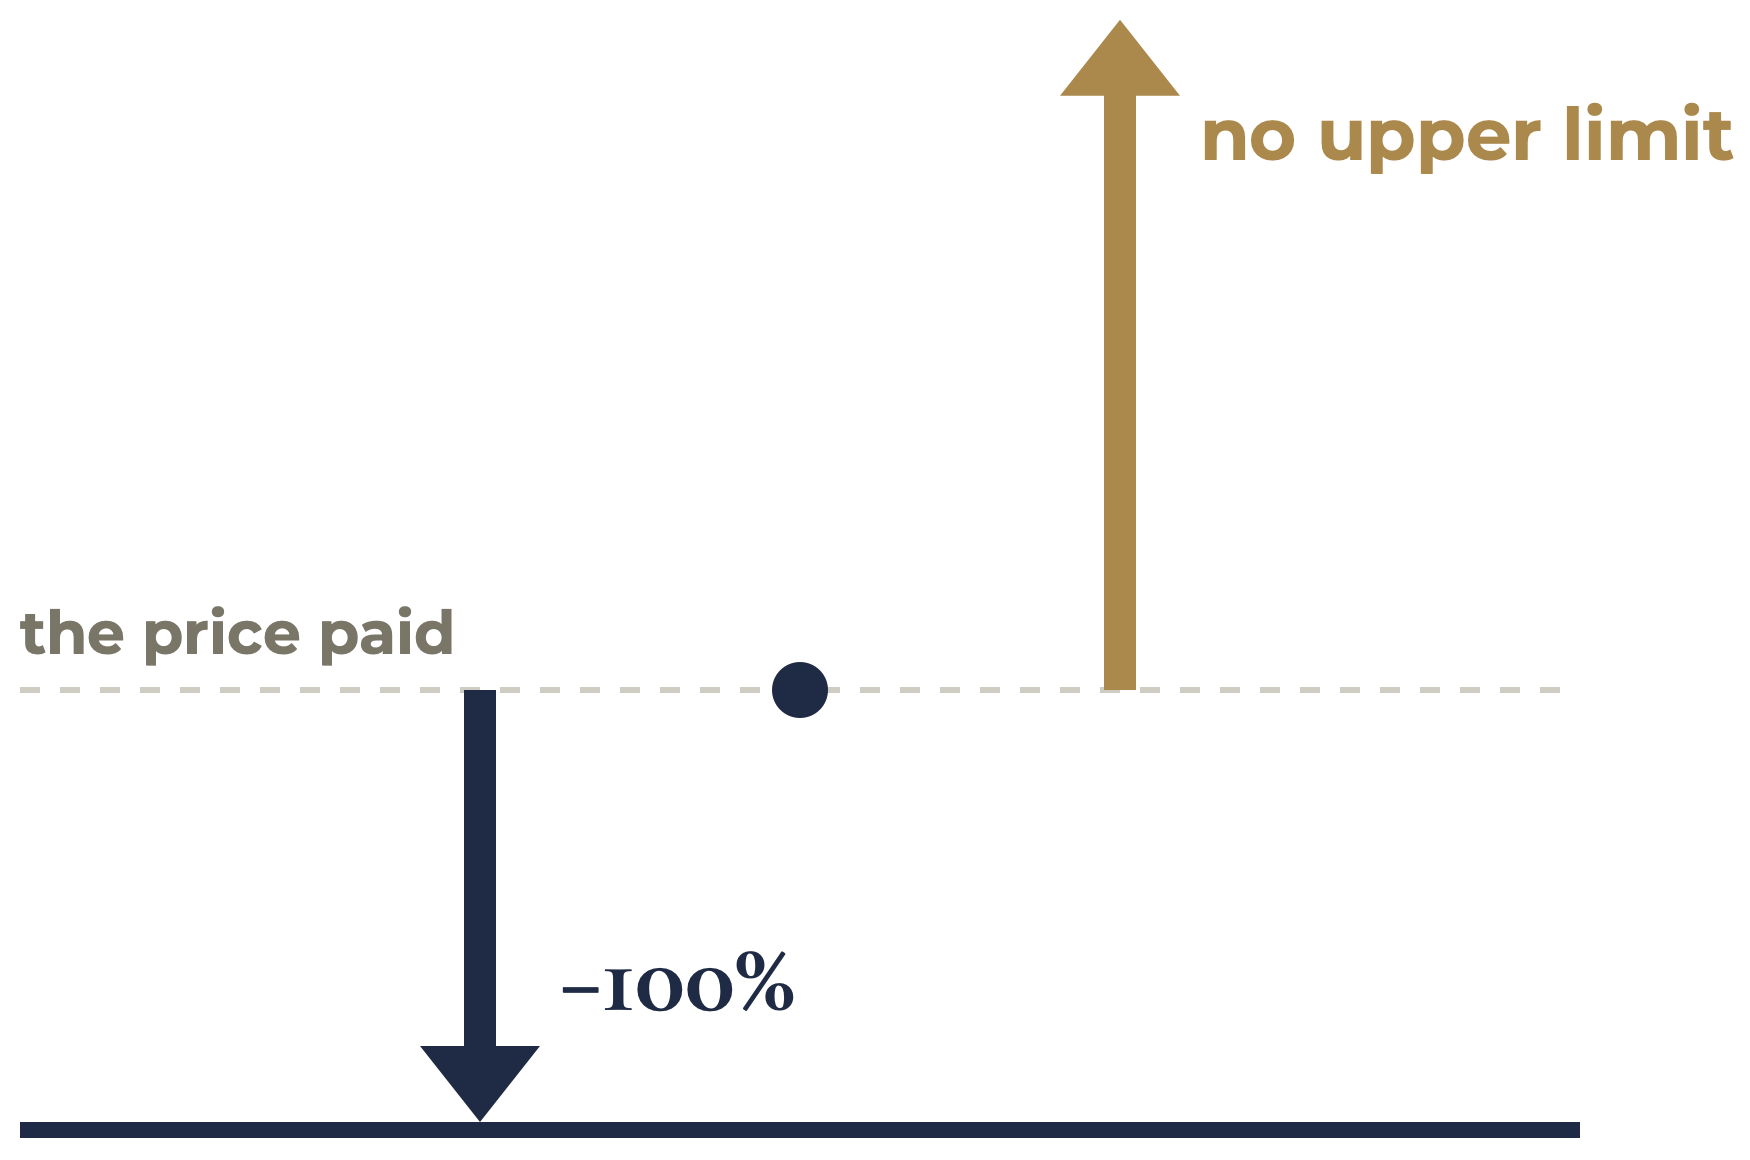
The amount of loss from investing in common stock is capped at the amount invested. The potential for gain is limitless.
A $10,000 investment loses at most $10,000. The potential for gain is limitless.
5. A few stocks produce most of the gains
Hendrik Bessembinder, a finance professor at Arizona State University, studied every U.S. common stock from 1926 to 2016. About 4% of the stocks produced all of the market’s net gain over Treasury bills. More than half of all stocks lost money over their lifetimes.
4 in 100 stocks produced all of the gains.
Every U.S. stock, 1926 to 2016, against Treasury bills.
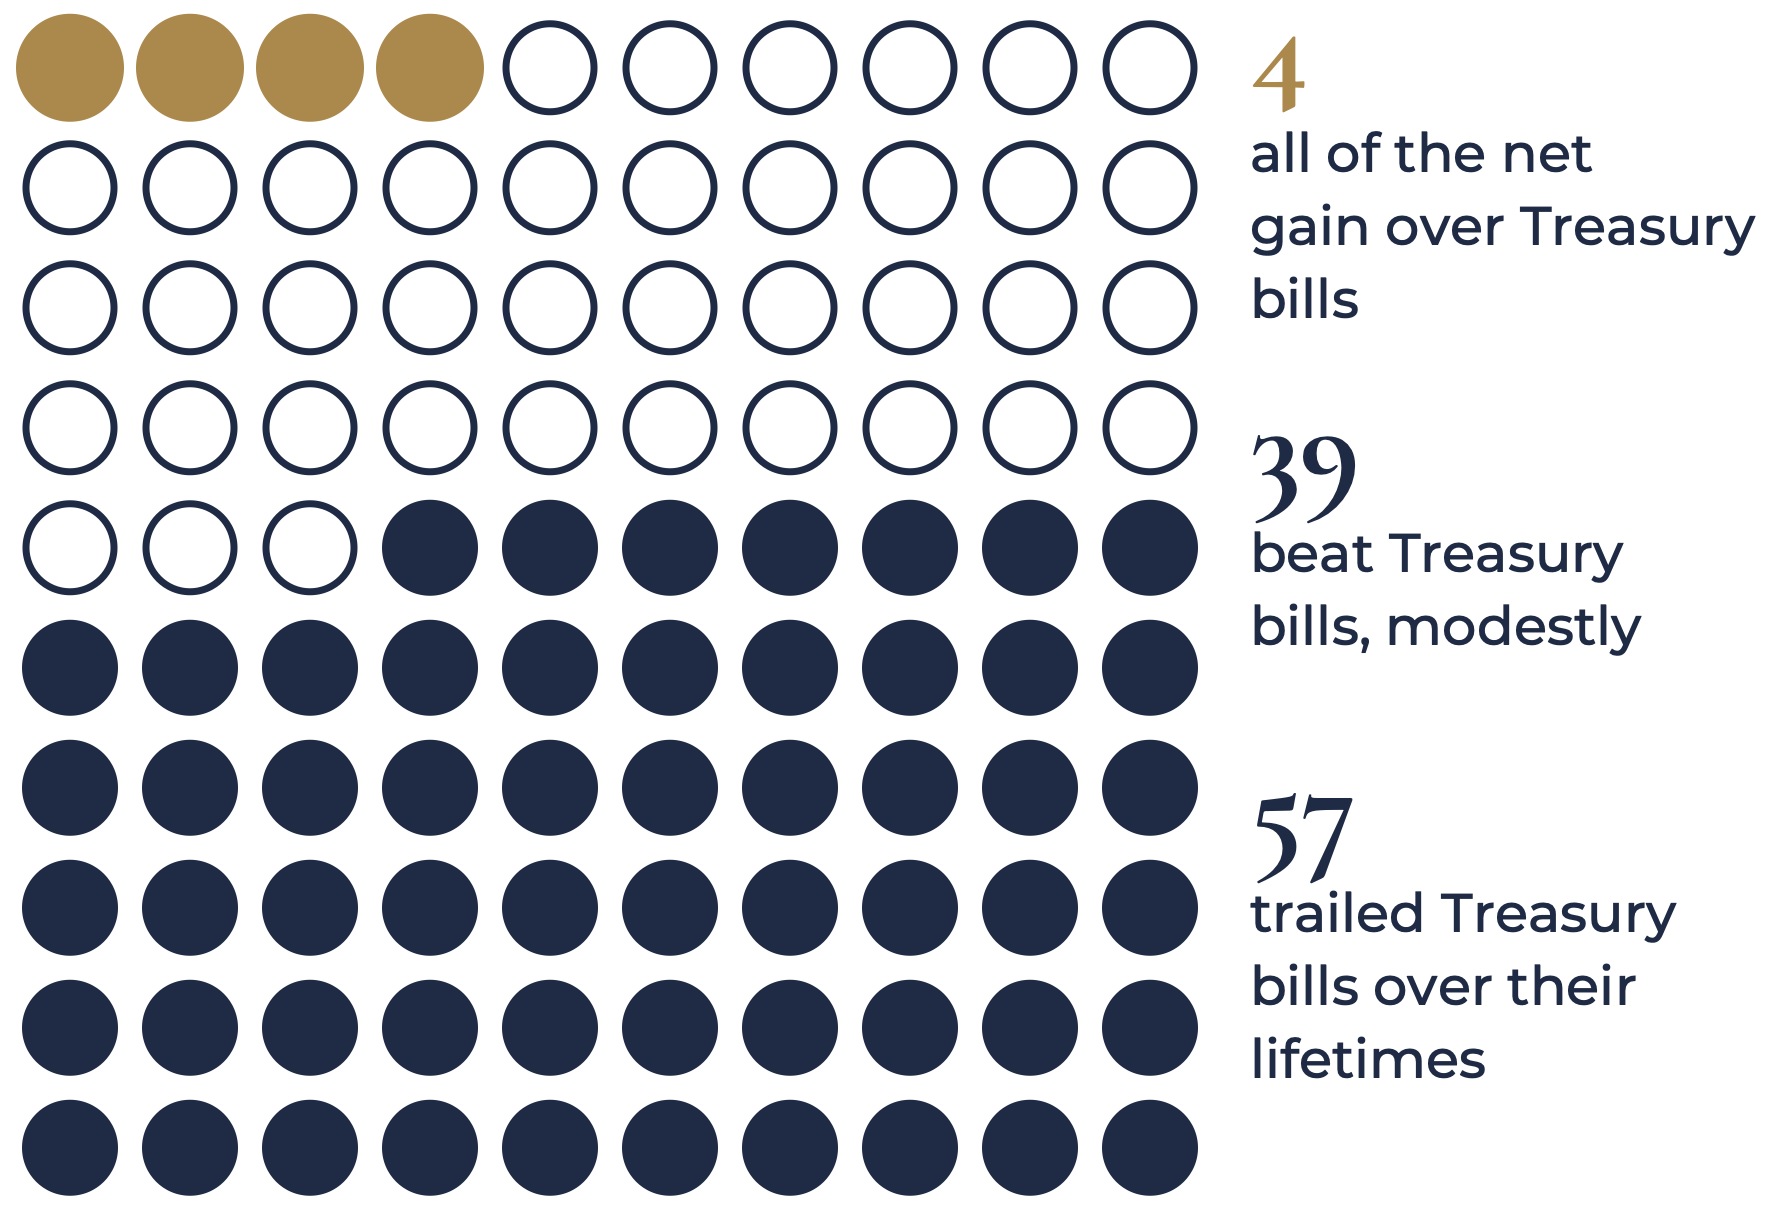
This supports two different approaches. An index fund owns every stock, so it owns the few big winners. A concentrated portfolio tries to find some of those winners and hold them. Holding them means sitting through years like the one in Figure 1. We run both kinds of portfolio, depending on the client.
6. Signal or noise: how to judge when a price drops
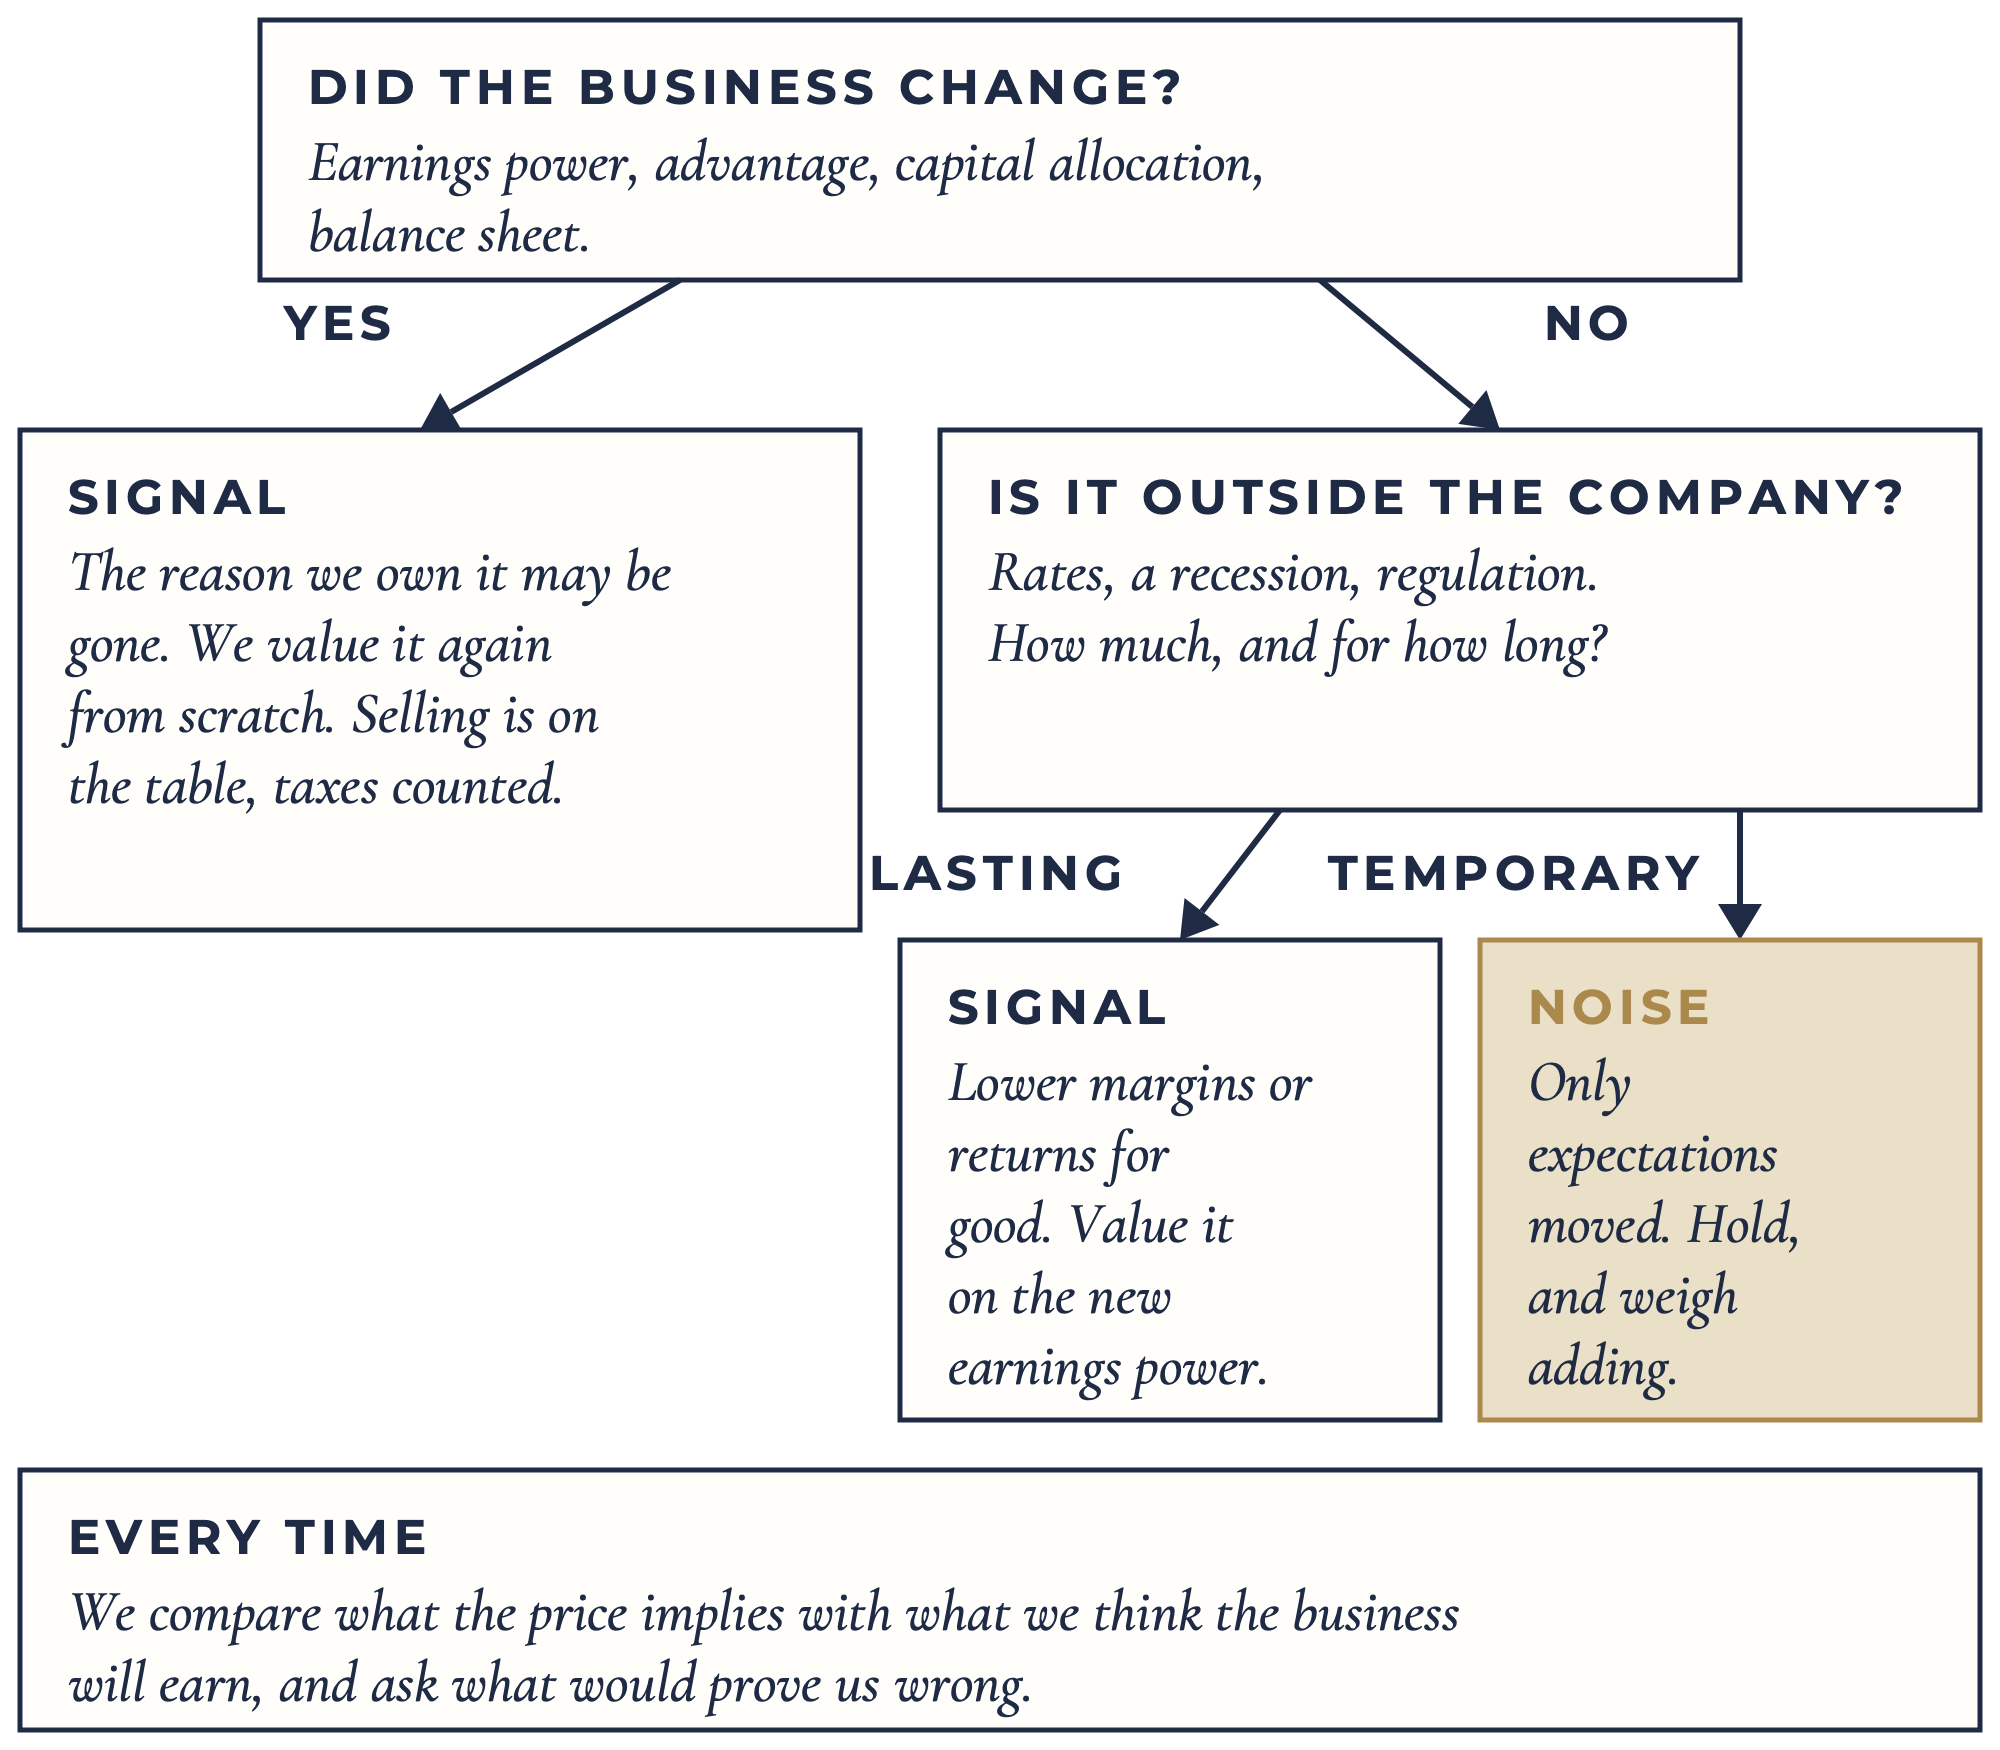
Every stock price implies expectations: how fast the business will grow, for how long, at what margins, and at what return on the capital it reinvests. Michael Mauboussin and Alfred Rappaport call this expectations investing. When a price drops, the question is simple: did the business change, or only the expectations?
We check earnings power, the competitive advantage, how management allocates capital, and the balance sheet. If none of these changed, the drop is noise.
Sometimes the cause is outside the company: interest rates, a recession, new regulation. Then we ask how much it changes earnings, for how long, and how much it changes our certainty about the long-term result. A recession that cuts one or two years of earnings changes the value of a durable business very little. A change that lowers margins or returns on capital for good changes it a lot. The first is noise. The second is signal.
We also check our own judgment: what would prove us wrong, and has it happened? Lynch makes the same point: if you can’t explain in a minute or two why you own a company, you probably shouldn’t own it.
Signal or noise: how to judge when a price drops.
7. Money needed soon is kept separate
Lynch also said investors have lost far more money preparing for corrections than in the corrections themselves. That is true for long-term money. It is not true for money you need soon. In the 2025 interview, Lynch gave the example himself: a family with three children starting college in two years should not have that money in stocks. So money a family needs in the next few years is held separately, in lower-risk investments. The long-term money never has to be sold during a drop.
- A single stock often moves 50% to 100% from low to high in a normal year (Peter Lynch).
- The S&P 500 drops about 14% within a typical year. Only 10 of 46 years (1980–2025) ended lower.
- A 30% drop needs a 43% gain to recover. A 50% drop needs 100%.
- Loss is capped at the amount invested. The potential for gain is limitless.
- About 4% of U.S. stocks produced all of the market’s gain over Treasury bills, 1926–2016.
- When a price drops, we check what changed: the business, or only the expectations priced into it.
- Money needed within a few years is kept separate, so long-term holdings never have to be sold during a drop.
Questions about your own situation?
Begin a conversation →Educational content only. This article is for informational and educational purposes and does not constitute personalized investment, tax, or legal advice. It does not create an advisory relationship. Nothing here is a recommendation to buy, sell, or hold any security or to adopt any investment strategy. Your circumstances are unique; consult a qualified professional who knows your full situation before acting.
No companies are named. References to Peter Lynch (including his 2025 conversation with Josh Brown and his years managing a mutual fund), to Michael Mauboussin and Alfred Rappaport, and to the research of Hendrik Bessembinder reflect their documented, publicly available work and do not imply their endorsement of the firm. Market data are from MFS and LPL Research and reflect the S&P 500 index, which cannot be invested in directly. Figures 1, 3, and 4 are hypothetical illustrations, not projections and not the results of any investment. Diversification does not guarantee a profit or protect against loss. All investing involves risk, including the possible loss of principal. Past performance is not indicative of future results. The firm and its related persons may or may not hold any security, fund, or asset class mentioned, and any such position may change at any time.
TenBroeck Wealth Management, LLC is an investment adviser registered with the State of California (DFPI). Registration does not imply a certain level of skill or training. The firm is affiliated through common ownership with TenBroeck Insurance Services, a licensed insurance agency; the firm or its representatives may receive commissions on insurance products implemented for clients — compensation separate from advisory fees that creates a conflict of interest. Clients are under no obligation to purchase insurance through the affiliate. This and other material conflicts are described in the firm's Form ADV Part 2A, available upon request.
Written by Schad TenBroeck, CFP®. CFP Board owns the marks CFP® and CERTIFIED FINANCIAL PLANNER® in the United States.
Look up the firm (CRD #304388) and Schad TenBroeck (CRD #7164172) on Investment Adviser Public Disclosure.